By Robert Soler
The Importance of Light for Plant Growth
Plants have evolved around the sun as their natural source of energy. This is important because the sun is at an infinite distance away, with a predictable cycle over the course of days and seasons. The more light a plant receives, the more it will grow and thrive.
In the natural environment, when a plant sees uneven light day after day, it can only mean one thing—the plant is partially shaded. Thus, the plant will maximize its light exposure and orient itself to utilize the available light as best as possible. This partially shaded plant will grow taller and leafier wherever sunlight is present, to capture as much light as possible. The fact that the sun has relative infinite distance is important, because a 30” tall plant may see 1,000 umol/m2/second at the top leaves—but if that same plant grows to 40” tall, it will still see 1,000 umol/m2/second at the top leaves. The difference between the bright and dark areas are the same. The effect of shadowing is no different over the course of a 24-hour day. All is well in the plant’s world.
Electric Lighting – Intensity + Distance Recommendations
Now let’s fast forward to the built environment, wherein plants are grown under electric lighting. Each of these electric light sources has an engineered distribution to get an even distribution on the plant canopy. For example, a High Intensity Discharge (HID) lamp—like High Pressure Sodium (HPS)—should have a batwing distribution. as shown in Figure 1. Creating a batwing distribution is a great way to get even uniformity, where you have high intensities at higher angles and less intensity directly below. In the example below, the highest intensity is 832 umol/sr/second. This number gets translated into “photosynthetic photon flux density” or PPFD (umol/m2/second) via the “inverse square law”, where the incident angle can be ignored as the plant will naturally turn towards the brightest point through phototropism, and the math distills nicely down to:
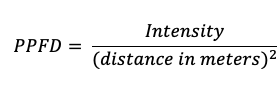

Figure 1. HPS Sodium Polar Plot (top) with a peak intensity of 832 umol/sr, and a BIOS LED light source (bottom) with peak intensity of 62 umol/sr/second.
In order to make sense of these PPFD values, you need to understand the range of light levels for growing fruiting or flowering crops such as Cannabis or Tomatoes. Figure 2 provides an overview of typical recommendations for a wide range of fruiting and flowering crops, where:
- A PPFD below 600 is enough to sustain the plant but not enough to really promote growth.
- 600 to 1,100 PPFD (umol/m2/second) is optimal PPFD for good growth without any negative impacts of too much light.
- From 1,100 to 1,500 PPFD, there are no added benefits from the added PPFD and some signs of damage are starting to show.
- Above 1,500 PPFD, you are now causing significant harm to the plant, thereby affecting your crops.
For better visuals, higher intensity (umol/sr/second) is represented by a wider arrow.

Figure 2. Effect of different light levels on plant growth (right) and the distance away from a light source in order to fall within said range (left). For example, if you have a light source with 800 umol/sr intensity, the plant surface must be between 32” and 40” away from the light to be within the “optimal light” range for growth.

Electric Lighting Applications for Plant Growth Uniformity
High-Pressure Sodium
When a system using High-Pressure Sodium (HPS) is used, it is designed and spaced to have even illumination, negating the impacts of these potentially damaging light levels; this is how it works in the case of buildings. However, when you combine this with a dynamic system, such as a growing plant canopy, the results can be hazardous for the plant. This is illustrated in Figure 4, which shows how the plant grows into the distribution of the light source. With HPS, you first start at a distance of about 40” from the light source. As it grows, the uniformity breaks down, and where the two light sources overlap in distribution, too much intensity occurs and the plant will then receive hazardous amounts of light.

Figure 4. Overview of growth over three different stages of growth under HPS lighting, with distribution as illustrated in Figure 1. The chart illustrates how PPFD changes as the plants grows, creating uneven uniformity and exposing the plant to hazardous PPFD light levels.
LED
When using an LED lighting system, what you want to strive for is the exact opposite—the most amount of LED bars evenly spaced. Starting at a much closer 12” distance, each bar provides a much lower and less hazardous amount of light that creates an even PPFD over the entirety of the growth of the plant. Based on the standard 120 degrees distribution from LED lighting, this leads to ideal uniformity up until the growth distance is 2/3rd of the bar-to-bar spacing. For example, in Figure 5, we show a bar-to-bar spacing of 6”. Ideal uniformity can be obtained when as close as 4” (2/3rd of 6”) away, without enabling hazardous levels of light.

Figure 5. Overview of growth over three different stages of growth under LED lighting, with distribution as illustrated in Figure 1. The chart illustrates how PPFD remains in the optimal lighting zone throughout all stages of growth.
Breakdown of Inverse Square Law
Those who look back at the table from Figure 2 may notice that even low outputs such as 50 umol/sr/second might incur damaging amounts of light. However, it should be noted that these intensity levels are obtained using measurements taken at a long distance away from the light source (known as far field photometrics). These numbers really start to break down once you are within a distance equal to the maximum diameter of the light source.
Let’s assume that the LED bar is over 40” in length. Once you are less than 40” distance from the light source, you can start to assume that the entirety of that bar is not contributing to any given spot on the canopy surface. At 4” distance, you can confidently cut the intensity down by a factor of 3. This means that you will never approach the intensities where you might incur damage (see Figure 6).

Figure 6. Inverse Square Law example for plant growth.